Overview of new methods for viscosity measurement in the early stages of biopharmaceutical development
2022-11-05 09:07:50
Viscosity measurement is especially important for many of the analytical challenges faced by researchers in the pre-formulation development phase of pharmaceuticals, particularly biopharmaceuticals. Accurate determination of viscosity early in the development of biologics plays a key role in reducing the number of failed candidate samples in subsequent development stages. For valuable samples with very small sample volumes, the measurement is particularly difficult when measured according to the formulation conditions (usually at high concentrations).
Conventional viscosity measurement methods are often not performed under the above circumstances. In addition to the small sample size, there is an increasing need for automated measurements of high-throughput, multi-parameters on the same small sample. This article describes the application of UV-regional imaging technology in the automated measurement of biologic viscosity and molecular size and its advantages over traditional techniques.
Developing injectable biological therapies
In the development of biological therapy, the efficacy of the drug and the experience of the patient are critical factors. Since most biomolecules are unable to withstand the harsh environment of the gastrointestinal route, intravenous, intramuscular or subcutaneous injections are usually used. The concentration of active molecules must be relatively high, typically exceeding 100 mg/mL to compensate for their shorter plasma half-life. One of the biggest challenges is how to develop high-dose formulations that can be injected at low doses for maximum effectiveness and patient comfort. Because in biopharmaceuticals, high concentrations often mean high viscosity and potential problems with parenteral administration.
Biologic formulation is an attractive area, and the understanding of this field and the analytical tools system that can support its development are also very rapid. However, one of these measurement challenges has only been fully resolved until now, namely how to screen formulations with low viscosity properties or those that do not meet the specified viscosity range in the early stages of development. Traditional viscosity measurement techniques, including rotational rheometers and standard capillary viscometers, are not well suited for the early development of biopharmaceuticals because of the need to perform multiple tests with very small amounts of precious samples, which are useful for microanalysis, High throughput and sample recovery requirements are very high. There is now a new solution to this measurement problem that combines UV-area imaging with a microcapillary viscometer to provide fast, high-throughput and non-destructive viscosity and molecular size measurements for biopharmaceutical formulations. Reliable measurement of viscosity at an early stage of the development process opens up the possibility of selecting candidate biotherapeutic formulations with better injectability.
UV area imaging for viscosity and dimensional measurements
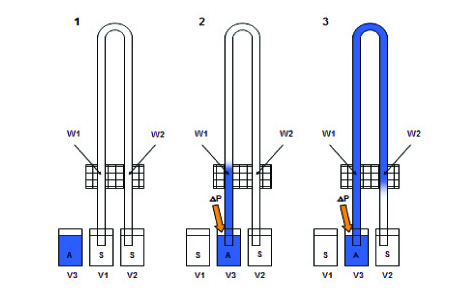
In this application, UV-area imaging is used to monitor the change in absorbance over time of a UV-active sample through microcapillary processes, including proteins, peptides, and other molecules containing UV chromophores. Capillary viscometers have long been used to determine the viscosity of a sample by simply measuring the time it takes for the drug to pass from the port to the detector, but since it is always affected by the injection time error, it can easily lead to major errors in subsequent calculations. The new system uses a two-channel capillary design. The sample flows through the UV detection window twice through the capillary, so that the time of the sample passing through the window can be accurately detected, and the viscosity of the sample can be accurately measured. Analysis of sample viscosity and size is based on time variations between the two windows.
At constant temperature and constant pressure, the viscosity of the sample can be referenced to a sample of known viscosity, obtained by detecting the time between two passes of the UV detection window. Sample detection can be achieved by using a UV imaging array to perform a series of separate snapshots of the sample according to the absorbance range of the specific sample. The signal processing algorithm is used to determine the viscosity of the sample, and the appropriate time shift is selected to comprehensively calculate the average state of the aforementioned snapshot, and then convert it into accurate viscosity, molecular size and concentration measurement values.
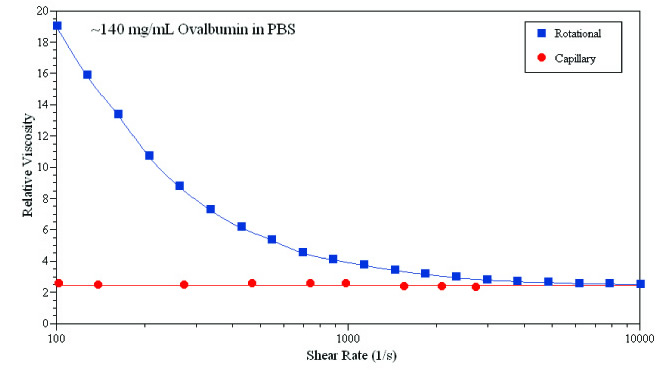
The assay relies on the unique UV absorption of a particular molecule rather than its physical properties. This feature allows it to measure very low sample volumes - for viscosity measurements, sample volumes are less than 10 microliters; for dimensional measurements, sample volumes are less than 10 nanoliters. Since the UV analysis technique does not harm the sample, the analyzed sample can be recovered. In contrast, traditional rheological techniques can measure the viscosity of a protein sample, but at the same time shear thinning the sample; at the interface where the sample is in contact with air, the effects of shear, protein adsorption and deterioration are more serious.
Figure 2 compares the rotational rheometer with a viscometer based on ultraviolet region imaging. The results show that the two techniques have significant differences in the effect on the sample. Microcapillary analysis techniques did not observe shear thinning, suggesting that shear thinning that occurs in rotational rheological measurements may be due to the loose structure of the air-sample contact interface.
In the ultraviolet area imaging system, there is no contact problem between the sample and the air in the fully enclosed microcapillary, which can prevent the sample from being damaged or contaminated during the analysis, so that the sample can be reused. Combined with the ability of high-throughput analysis, UV-area imaging is especially useful for early screening of biotherapeutics.
Analysis type flexibility
One of the appeals of imaging in the UV region is its ability to perform multiple measurements. In addition to simple viscosity analysis, this method can also be used to analyze molecular size and sample concentration.
Characterization of the size of small molecules located in complex systems is very difficult due to being covered by larger molecules. Therefore, traditional dimensional measurement methods require the use of high concentrations of samples to ensure the effectiveness of the analysis. Size analysis using UV-area imaging is not limited by molecular size, providing a potential solution to these problems. Since different samples have different UV absorption wavelengths (assuming that the ultraviolet absorbance of the molecule can be detected), the signal reaction of the target molecule can be specifically detected.
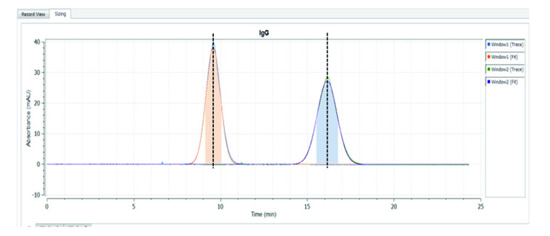
The calculation of the dimensions is similar to the way viscosity is measured. As the sample flows along the capillary, the diffusion of particles or molecules causes a peak spread, but this expansion is attenuated by lateral diffusion. The smaller the molecules present, the faster the lateral spread and the narrower the peak region. When larger molecules are present, the lateral diffusion is slowed down, thereby widening the peak region.
As shown in Figure 3, we can use the variation of the peak region width between the two windows to calculate the molecular hydrodynamic radius we are interested in. Finally, UV area imaging can also be used as a method of detecting the concentration of a particular active ingredient. Beer-Lambert's law directly relates UV absorption to chromophore concentration, making it possible to determine the amount and size of a particular substance present in a solution. In summary, the application of the UV area detector achieves three measurement functions, namely the viscosity of the overall solution, the molecular size contained therein, and the measurement of its concentration.
Application example - Effect of excipients on viscosity of protein formulations
High-concentration, low-viscosity formulation development is currently the focus of research, and an important strategy to achieve this goal is to add a viscosity-reducing excipient to the formulation.
The addition of small molecule excipients such as arginine, dimethyl sulfoxide and hydrophobic salts can inhibit the formation of polymeric networks and reduce the viscosity of high concentration protein solutions.
A recent study described how microcapillary viscometers based on UV-area imaging identify differences in viscosity between different protein excipient formulations and demonstrate the ability to screen for appropriate candidate formulations over a range of viscosities [1] How to apply this technology. The data listed below was obtained from a commercial UV area imaging system (Malvern Instruments, Viscosizer 200).
Contains a concentration of 400 mg/mL bovine serum albumin (BSA) protein stock in two different vehicle buffer solutions: both contain 30 mM histidine, pH 5.3, but one of the buffer solutions Contains 200 mM arginine. A series of dilutions were prepared from these stock solutions and the concentration of each solution was determined by standard ultraviolet spectroscopy. Load into a glass vial at 100 °L/fraction at 20 °C and place on the autosampler spin disk of the instrument.
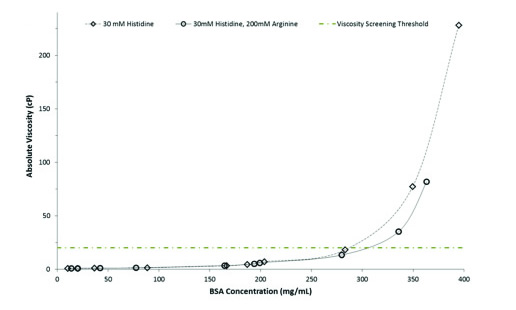
The change in the above samples was monitored between the two detection windows at a wavelength of 214 nm. The resulting viscosity results are then recorded, plotted against each other, and plotted against a predetermined viscosity range, as shown in Figure 4.
Figure 4 shows the absolute viscosity as a function of BSA concentration. As expected, the absolute viscosity of the formulation increased with increasing concentration. When the concentration was below 250 mg/mL, there was no significant difference between the two buffer solutions. However, when the concentration was higher than 250 mg/mL, the viscosity of the BSA formulation solution in the 30 mM histidine buffer without arginine addition was higher than those of the arginine-containing formulation. There is evidence that arginine can reduce protein viscosity, especially in the study of monoclonal antibodies [2, 3, 4].
in conclusion
The production of high-concentration, low-viscosity biotherapeutic agents is one of the major challenges facing the pharmaceutical industry today. The new technology described in this article combines UV-region imaging with a microcapillary viscometer to provide an efficient high-throughput technique for non-destructive analysis of very small amounts of unmodified samples at formulation concentrations. Biopharmaceutical development provides strong support. This allows pharmaceutical manufacturers to determine their viscosity profiles when screening for drug candidates in the early stages of drug development, and to identify any problems that may be encountered in later production. It is possible to determine early whether it is necessary to continue (or terminate) the next screening of candidate molecules, which will achieve high economic benefits.
references
[1] Effect of Excipients on Viscosity of Protein Formulations - Study of Trace Sample Viscometers by Viscosizer 200: Malvern Instrument
Company Application Report (August 19, 2013) Click to download
[2] TJ Kamerzell, AL Pace, M. Li, DM Danilenko, M. McDowell, YR Gokarn, YJ Wang, “Polar solvents reduce the viscosity of high-concentration IgG1 formulation solutions by hydrophobic solute and interaction: formulation and biologics Capacitive Impact 2013, J Pharm Sci , 102 (4) 1182-93
[3] Z. Guo, A. Chen, RA Nassar, B. Helk, C. Mueller, Y. Tang, K. Gupta, AM Klibanov: Structure of Hydrophobic Salts as Reduced Viscosity Excipients for Monoclonal Antibody Concentrated Solutions - Active Relationships, Pharm Res , 2012, 29 (11): 3102-9
[4] J. Liu, MDH Nguyen, JD Andya, SJ Shire, “Reversible self-association improves the viscosity of high-concentration monoclonal antibodies in aqueous solutionsâ€, J Pharm Sci , 2005, 94 (5): 1928-40

Figure 1: Schematic diagram of sample analysis using UV area imaging. Instead of detecting the time from sample injection to the detector, the time interval during which the sample passes through the UV window through the capillary is detected.

Figure 2: Detection of naturally occurring ovalbumin shear thinning using a rotary rheometer (Kelvin Instruments, Kinexus) and a microcapillary viscometer with UV region imaging (Malvern Instruments, Viscosizer 200).

Figure 3: Variation in sample peak shape between two windows for analysis of the hydrodynamic radius of the molecules in the sample to be tested. Smaller molecules produce higher and narrower peak shapes, while larger molecules produce shorter and wider peak shapes.

Figure 4: Curve of absolute viscosity of excipients with BSA formulation as a function of concentration. The figure shows that the viscosity of the four formulations exceeds the critical 20 cP.
(Author: Dr. Lisa Newey-Keane, Malvern Instruments biopharmaceutical product manager)
Shelled shrimps,Dried shrimps,Frozen Bamboo shrimp,Pandalus borealis,Red Shrimp,Coldwater Shrimp
Zhejiang ocean family co.,ltd , https://www.ocean-family.com